Premier League Carbon Reporting
What do the latest round of annual accounts from clubs tell us about their progress in reducing emissions?
Yes, the timing of this post might seem a bit back-to-front. My last post covered scope 3 emissions by Premier League clubs. This one is going to look at their scope 1 and 2 emissions (and energy consumption).
I’ve waited to write this post until all Premier League club’s annual accounts for 2021/22 were published. These include ‘streamlined energy and carbon reporting’ (SECRs) that cover scope 1 and 2 emissions. An explanation of the different scopes is at the bottom of this post.
This is now the third year for which we have had these reports so we can start to look at how clubs are doing over time. Clubs use a number of different reporting methodologies and have a wide range of individual circumstances. The information in the tables below is best not used for comparisons between clubs, but to look at overall themes.
If you have not yet read the accompanying post on scope 3 emissions I recommend you do so asap. Scope 3 emissions cover the lion’s share of emissions in football and are hugely important to a rounded picture.
As ever, I’m learning as I go along. So before I get to it, just to say again, your additional analysis, comments and corrections, are hugely important to building shared understanding. And as the focus is on English clubs here, it would be particularly good to hear from readers based elsewhere.
On to the main course …
Scope 1 emissions
Scope 1 emissions are direct emissions by an organisation, mainly from its gas boilers when used for heating. The table below shows Scope 1 emissions as reported for ten clubs between 2019/20 and 2021/22. It also has figures for five further clubs for 2021/22 only where figures for 19/20 are not available.
Over the period 19/20 - 21/22, out of ten clubs:
Six clubs have seen their scope 1 emissions drop and four have seen them increase.
Some clubs have seen minimal changes in their emissions (Bournemouth -4%, Brighton -1%, Manchester City +5%), while others have seen large percentage changes (Crystal Palace +97% and Spurs +155%).
Overall scope 1 emissions have increased 24%. A significant amount of this is accounted for by the big increase in Spurs emissions - whose increase in emissions here are largely balanced by a large decrease in their scope 2 emissions (see below).
If Spurs emissions were to be excluded as an outlier, scope 1 emissions over the period would be almost unchanged.
For the period 21/22 alone, out of 15 clubs, Spurs (3,430 tCO2e), Chelsea (2,692 tCO2e) and Newcastle United (2,020 tCO2e) report the largest scope 1 emissions.
Scope 2 emissions
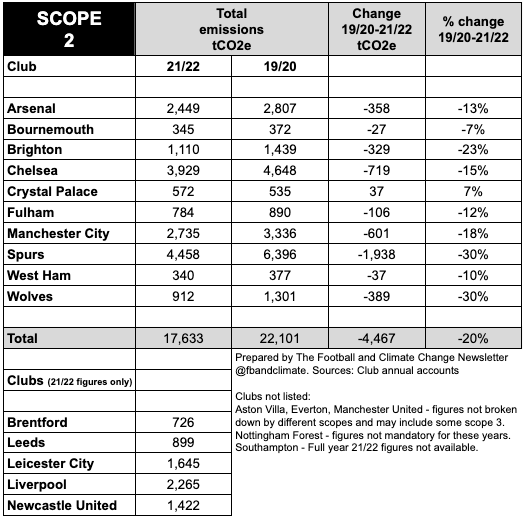
Scope 2 emissions are emissions from the energy that is purchased by an organisation and produced for it, especially electricity. The table below shows Scope 2 emissions as reported for ten clubs between 2019/20 and 2021/22. It also has figures for five further clubs for 2021/22 only where figures for 19/20 are not available.
Over the period 19/20 - 21/22, out of ten clubs, nine have seen their scope 2 emissions drop and only one, Crystal Palace, has seen them increase, with decreases of between 10% and 30%.
Overall scope 2 emissions have decreased by 20% and Spurs emissions have decreased by the largest total amount (1,938 tCO2e, 30%).
For the period 21/22 alone, out of 15 clubs, Spurs (4,458 tCO2e), Chelsea (3,929 tCO2e) and Manchester City (2,735 tCO2e) report the largest emissions.
Scope 1 and 2 emissions
The table below combines data on Scope 1 and 2 emissions as reported for ten clubs between 2019/20 and 2021/22. It also has figures for five further clubs for 2021/22 only where figures for 19/20 are not available.
Over the period 19/20 - 21/22, out of ten clubs, eight have seen their combined scope 1 and 2 emissions decrease while two have seen them increase.
Overall combined scope 1 and 2 emissions have decreased by 8% over the two-year period, or 4% annually.
Wolves have contributed the largest absolute and percentage decrease in combined scope 1 and 2 emissions.
For the period 21/22 alone, out of 15 clubs, Spurs (7,888 tCO2e), Chelsea (6,621 tCO2e) and Manchester City (3,935 tCO2e) report the largest emissions. For the same period, Manchester United reported 5,965 tCO2e total emissions using a “scope 2 market-based emission methodology”. But, as their figures are not broken down by scope, and may include some scope 3 emissions, they are not included here.
Energy consumption
The table below shows energy consumption as reported for twelve clubs between 2019/20 and 2021/22. It also has figures for six further clubs for 2021/22 only where 19/20 figures are not available.
Over the period 19/20 - 21/22, out of twelve clubs, eight have seen their energy consumption increase, while four have seen them decrease.
Overall energy consumption for the period is up 4.1%, or just over 2% annually.
For the period 21/22 alone, out of 18 clubs, Spurs (42.0 GWh), Chelsea (34.7 GWh) and Manchester United (24.1 GWh) report the largest energy use.
What does all of this tell us?
First of all, it’s important to be aware of the limitations of this data. It only covers a three-year period and that’s a period with Covid slap bang in the middle of it. Also, the club’s own SECR statements note the use of a number of different methodologies. For instance, some club figures may be net of ‘green tariffs’ while others are not (an issue for a post of its own possibly!).
With those provisos in place here are some initial observations on the overall figures …
Scope 1 emissions have not decreased over the period. This suggests that reducing these emissions (especially from gas heating) is proving a challenge and further work is particularly needed on this front.
Scope 2 emissions - largely from electricity use - have notably decreased over the period by 10% per year. This decrease closely aligns with a 9% decrease per year in converting kWh to CO2e, due to changes in the fuel generation mix (less coal, more renewables and nuclear). The UK Government's aim is for a fully decarbonised electricity system by 2035.
Energy consumption is slightly up over the period. Again, the reasons for this are not clear and it is despite a host of energy efficiency measures being mentioned by clubs, including everything from new LED lightbulbs to variable speed escalators to electric lawnmowers.
Related to this the UK Government has announced an “ambition to reduce total UK energy demand by 15% from 2021 levels by 2030, across domestic and commercial buildings and industrial processes”. It will be interesting and important to see how clubs and fans can contribute here.
There seems to be a pattern of clubs with larger ground capacity having larger emissions. However, this does not look like a neat correlation and I’ve not looked into this in-depth.
There is a wide variation in year-on-year progress by individual clubs within the overall figures. This suggests that to make further progress, a more granular understanding and targeting of the different items causing these emissions is needed.
I’d safely assume that clubs hold much more detailed information than is mandatory to present in these reports. It would be interesting to know more about what the big-ticket energy-using items are, and also what sharing of opportunities and challenges there is between clubs.
Scope 3 emissions are much bigger than scope 1 and 2 emissions combined, by a number of estimates they are at least 10 times more so. And alongside this, clubs can also have a wider impact on influencing fans to live more sustainably. Urgent action is needed on all these fronts.
Actions on these emissions need to be looked at in the round and placed within the context of ambitious overall strategies and detailed transition planning. Clubs are making some progress on these fronts. However, this seems very uneven - and that’s maybe a subject for another post too. More is needed in the face of the climate crisis we all need to address.
Some final notes …
For those wanting to delve deeper, I’ve placed all the relevant sections from their accounts in a single document. Tuck in and report back on anything interesting you find!
SECR requirements only apply to bodies with a turnover of more than £36m and more than 250 employees. There are a few other clubs that meet these criteria so I may expand this analysis in the future. For clubs that do not meet those criteria, it would be good to know what more can be done to understand their progress in a proportionate way.
It would be amazing to take all the data, plus other information from clubs, and place it within a data-explorer-type tool mirroring the one just launched by the UN Race To Zero campaign. If anyone has the expertise to do so, it would be great to hear from you!
These SECR’s can be a brain-frazzling read to get your head around. The UK Government has recently committed to testing updates to the guidelines to highlight best practices in these reports. The sooner the better!
Different emission scopes
Scope 1 emissions are direct emissions by an organisation, for instance from its boilers when used for heating.
Scope 2 emissions are emissions from the energy that is purchased by an organisation and produced for it, especially for electricity.
Scope 3 emissions are any indirect emissions from sources outside of an organisation’s direct control in its value chain.
A recent report by Play The Game explains each of these in more detail.
Fran James (he/him)
Football and Climate Change Newsletter
@fbandclimate
footballandclimatechange@gmail.com


